In this research, we explore novel ways of integrating free surface flow simulations with realistic 3D environmental visualisations. The research is conducted within the project of 3di, targeting improved possbilities for hydrologists and policy makers to discuss water management and flood protection strategies. The project is a combined industry- and academic effort within a consortium, bringing together the following institutions:
- Delft University of Technology – Computer Graphics and Visualisation Group
- Delft University of Technology – Department of Hydraulic Engineering
- Deltares
- Nelen & Schuurmans
The research is funded via the „Knowledge for Climate“ research council and various stakeholders within water policy protection planning (Hoogheemraadschap Delfland, Hoogheemraadschap Hollands Noorderkwartier).
The research comprises of two parts: The group for environmental Environmental Fluidmechanics research new methods for accurate, high-speed and large-scale flood simulations based on the quadtree subgrid method by Prof. dr.ir. Guus S. Stelling. The group also researches ways to detailly model urban floods and urban-environmental conditions related to that problem. The method uses lidar-derived Digital Elevation Models (DEM) as a bases, which are simplified and comprised in a 2.5D quadtree representation (2D quadtree, expressing height measurements as base value). These models are subsequently used to compute the free surface flow according to finite difference schemes.
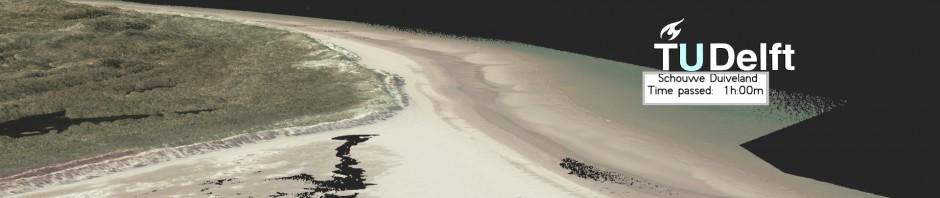
The second part, involving the Computer Graphics and Visualisation group, links the computational results of the flow simulation with high-resolution, coloured lidar pointsets on large scales. The currently largest, coherent topographic dataset of this kind is presented as permanent exhibition in the Delft Science Center, comprising a pointset landscape of 2 provinces (32,000 square kilometers on a resolution of 30 points per square meter, 2 terabytes of data [AHN aerial lidar]) and being visualised interactively in real-time. The core of the visualisation engine is a „Rendering-on-Budget“ algorithm (Level-of-Detail-organised, out-of-core Point-based Rendering), implemented within a Python-derived OpenSceneGraph implementation. In order to provide decision makers with environmental context for flood occurences, the engine also uses weather data from KNMI. Novel point modification methods, implemented directly on the GPU, allow groups of decision makers to interactively adapt the lidar terrain to discuss protection measures on-spot.
I worked as a PhD candidate for 1.5 years on the Visualisation research.
The results of this work are also accessible to the public via a permanent exhibition in the Delft Science Center, of which this video gives a little preview:
It’s a large-scale, 3D stereo visualization of South Holland and Zeeland, as well as the historic flooding event of 1953.
Related Publications:
-
![[PDF]](http://christian.kehl-foto.de/blog/wp-content/plugins/papercite/img/pdf.png) C. Kehl and G. de Haan, „Interactive Simulation and Visualization of Flooding Scenarios,“ in International Supercomputing Conference (ISC), 2012.
C. Kehl and G. de Haan, „Interactive Simulation and Visualization of Flooding Scenarios,“ in International Supercomputing Conference (ISC), 2012.
[Bibtex]@Conference{Kehl2012a, Title = {{Interactive Simulation and Visualization of Flooding Scenarios}}, Author = {Christian Kehl and Gerwin de Haan}, Booktitle = {{International Supercomputing Conference (ISC)}}, Year = {2012}, Note = {Best Research Poster Award}, Owner = {christian}, Pdf = {http://christian.kehl-foto.de/KehlDeHaan2012_ISC2012.pdf}, Timestamp = {2013.04.03}, Url = {http://christian.kehl-foto.de/KehlDeHaan2012_ISC2012.pdf} }
- C. Kehl and G. de Haan, „Interactive simulation and visualisation of realistic flooding scenarios,“ in Intelligent systems for crisis management, Springer, 2013, p. 79–93.
[Bibtex]@incollection{kehl2013interactive, title={Interactive simulation and visualisation of realistic flooding scenarios}, author={Kehl, Christian and de Haan, Gerwin}, booktitle={Intelligent Systems for Crisis Management}, pages={79--93}, year={2013}, publisher={Springer} }
- C. Kehl, T. Tutenel, and E. Eisemann, „Smooth, interactive rendering techniques on large-scale, geospatial data in flood visualisations,“ in Ict open 2013, eindhoven (the netherlands) 27-28 nov., 2013, 2013.
[Bibtex]@inproceedings{kehl2013smooth, title={Smooth, Interactive Rendering Techniques on Large-Scale, Geospatial Data in Flood Visualisations}, author={Kehl, Christian and Tutenel, Tim and Eisemann, Elmar}, booktitle={ICT OPEN 2013, Eindhoven (The Netherlands) 27-28 Nov., 2013}, year={2013} }